バイオインフォの森
森の道場
森の深淵
備忘録
用語解説
ABOUT
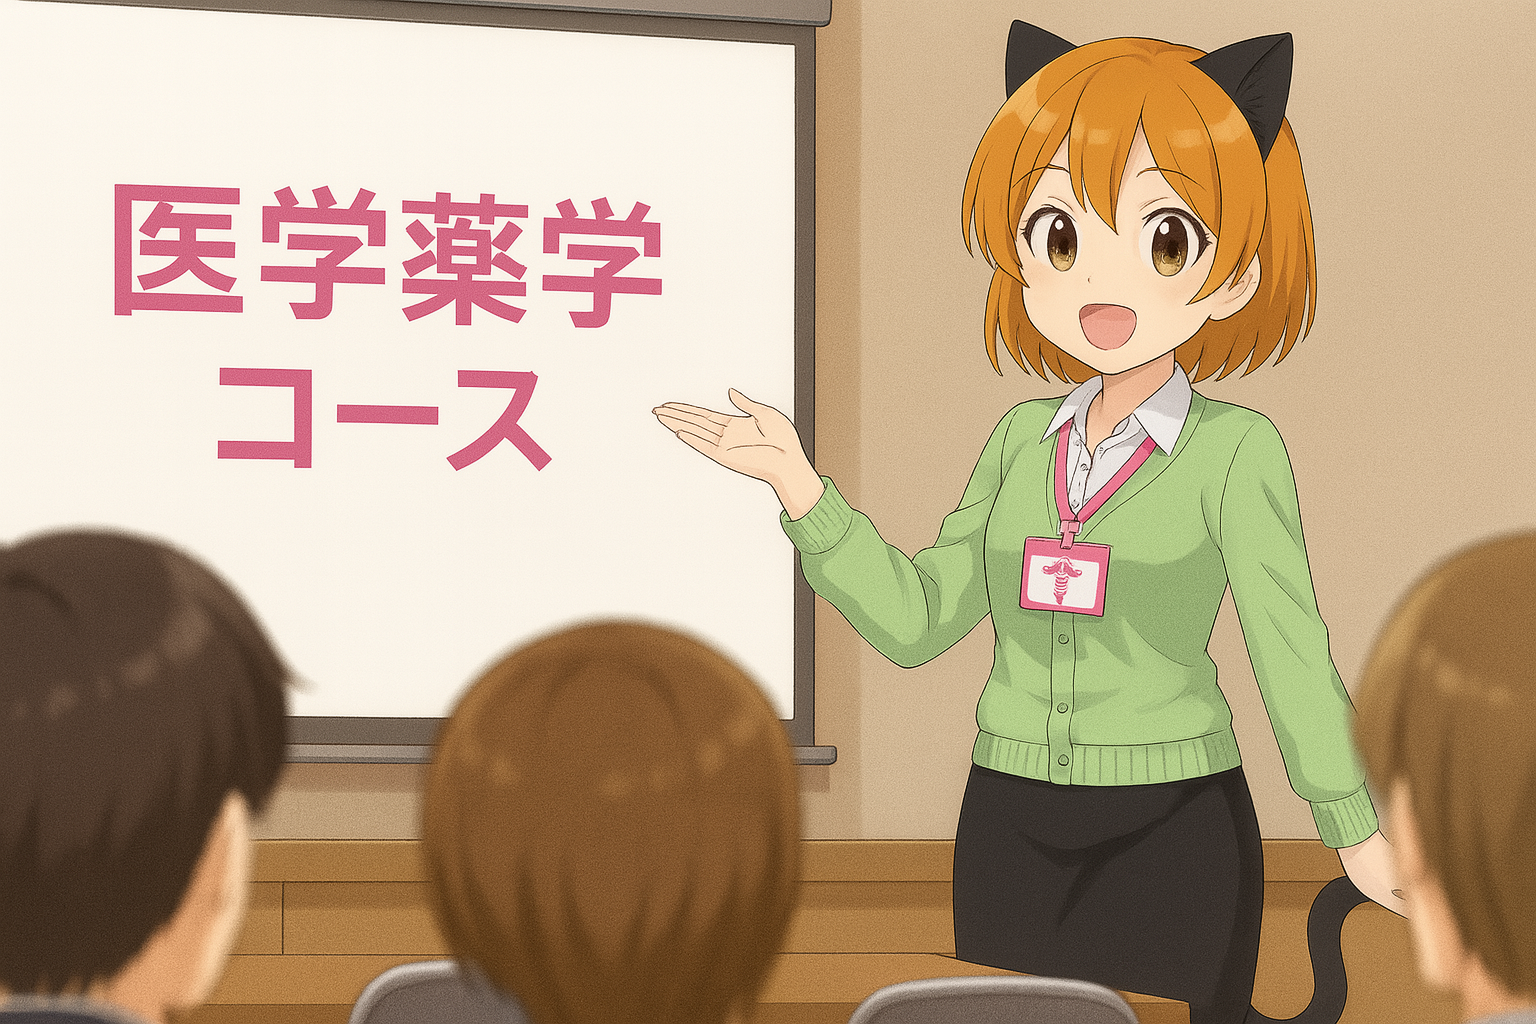
Bioinformaticsに必要な数学・情報科学・プログラミング・生命科学・医学薬学に関する学習コンテンツを横断的に揃えています。まずは各コンテンツで学習しましょう。
学習コース
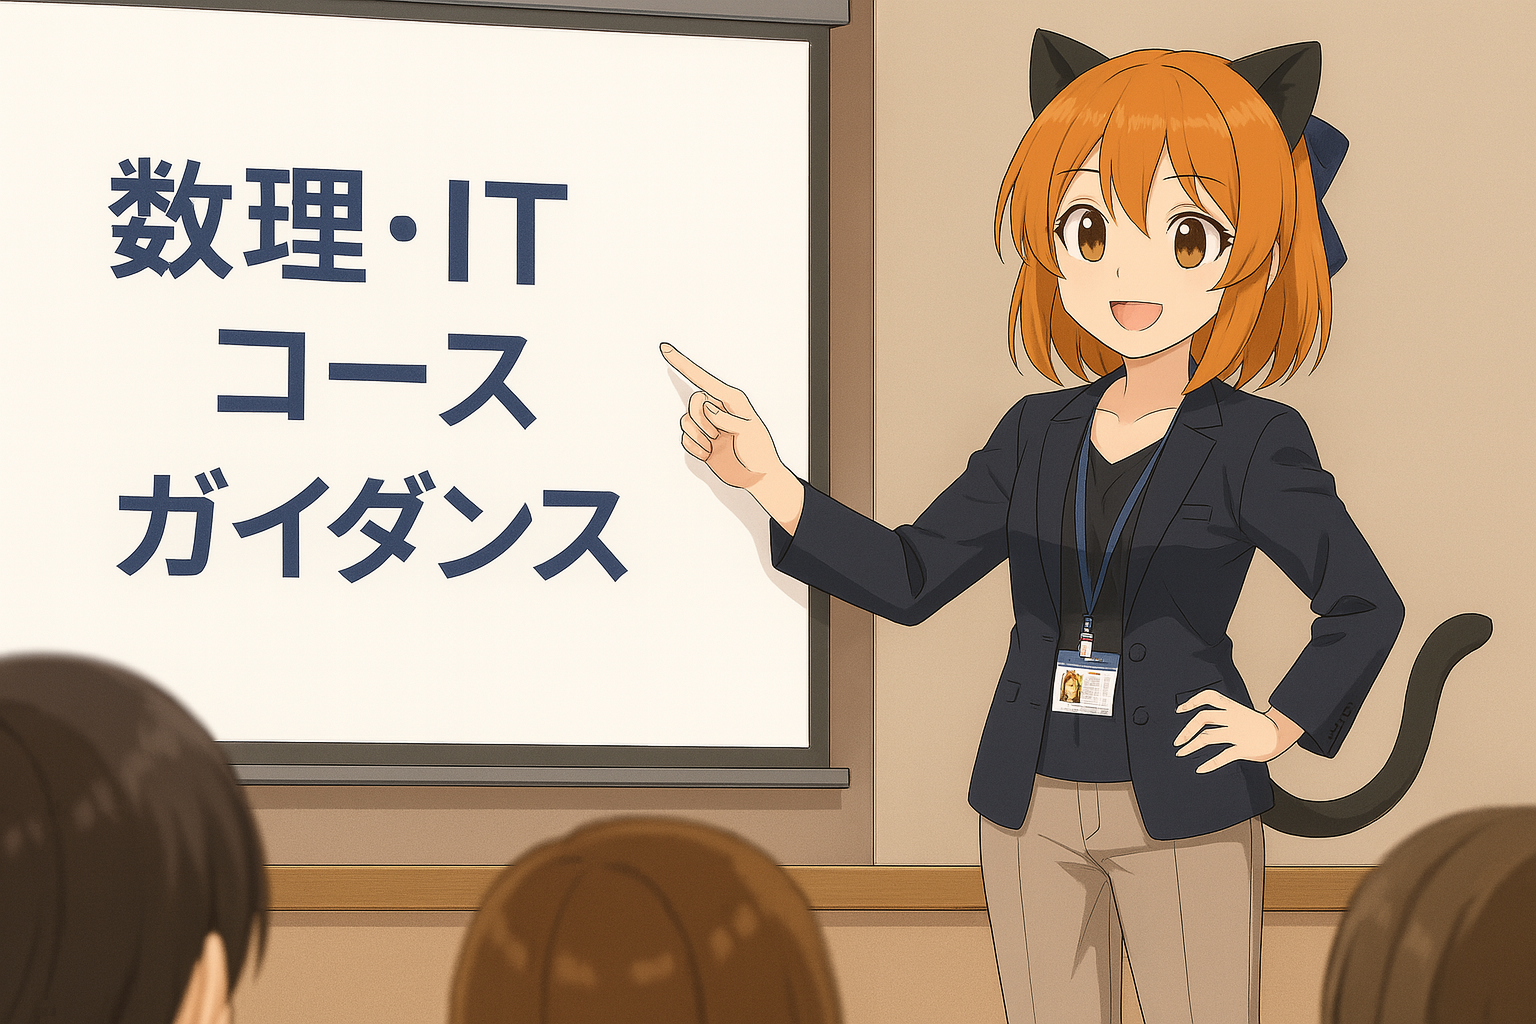
数理・IT
生命科学
バイオインフォマティクス